


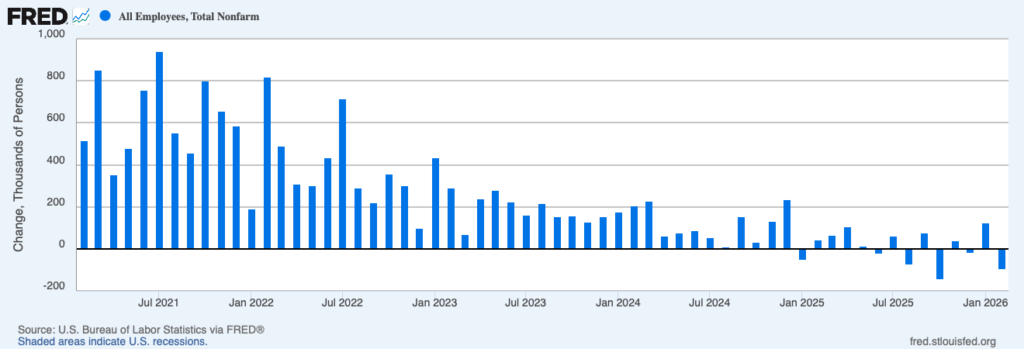
Many market watchers are concerned about the softening labor market. According to the Bureau of Labor Statistics, the US economy lost 92,000 nonfarm payroll jobs in February 2026. The revised payroll numbers reveal that the economy added just 156,000 jobs over the last year — or, roughly 13,000 jobs per month. That certainly looks sluggish relative to earlier reports. For comparison, the economy added roughly 122,000 jobs per month in 2024 and 210,000 jobs per month in 2023.
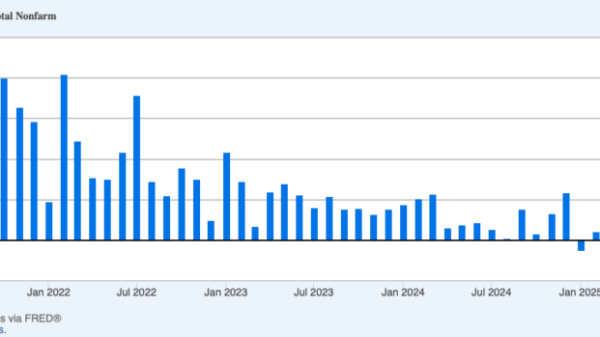
Figure 1. Monthly Change in Nonfarm Payroll Employment, Feb 2021 – Feb 2026
Some market watchers suggest the labor market looks even worse when you disaggregate the data. As economist Justin Wolfers notes, just one sector “continues to account for more than all of the jobs created over the past year.” Whereas health care and social assistance has grown 3.2 percent since the beginning of 2025, employment across all other sectors has declined 1.2 percent. That, the pessimists say, looks like concentrated job growth masking general malaise.
To the extent that those currently concerned by the most recent labor market data are merely looking for the proverbial canary in the coal mine, it is hard to fault them. It is difficult to identify turning points in real time, and it is prudent to consider whether what one is observing might indicate that the labor market is starting to soften. But the view that the labor market might be starting to soften is often conflated with a very different view: that the labor market is soft. And that latter view, at least at the moment, is inconsistent with the available data.
Zoom Out
Slow job growth is not necessarily a sign of a soft labor market. An economy at or near full employment will also experience slow job growth. And, when we zoom out on the labor market data, it certainly looks like we are at or near full employment, where everyone who wants a job at the prevailing wage has a job and unemployment reflects normal frictions associated with moving from one job to another.
Consider the prime-age employment-to-population ratio, which shows the share of people in the US between the ages of 25 and 54 who are currently employed and, correspondingly, tends to be a good indicator of labor market strength. In February 2026, 80.7 percent of prime-age workers were employed. That’s relatively high by historical standards.
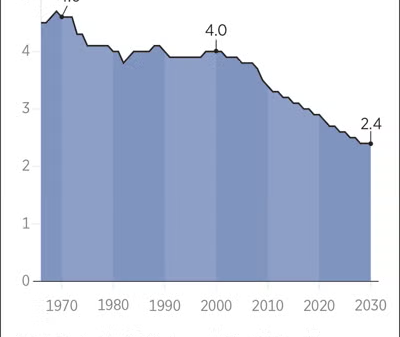
Figure 2. Prime-age Employment-to-Population Ratio, Jan 1948 – Feb 2026
The prime-age employment-to-population ratio climbed from 62.6 percent in 1948 to 80.2 percent in 1990, as women gradually entered the formal labor market. Since then, a prime-age employment-to-population ratio above 80.0 percent has generally indicated a relatively strong labor market, whereas a ratio that drops below that threshold typically indicates labor market weakness. The full series peaked at 81.9 percent in April 2000. Local peaks at 80.2 percent in March 2007 and 80.6 percent in January 2020 preceded recessions, but the series has been much more stable in recent years. The prime-age employment-to-population ratio has exceeded 80.0 percent since December 2022.
Reasonable people might disagree about the precise prime-age employment-to-population ratio that is consistent with full employment at any given point in time. And that ratio will change as families determine whether it is more advantageous to have dual earners or to have one member specializing in home production. But it is not obvious that family structure or other potential factors affecting the ratio consistent with full employment have meaningfully changed over the last six years. And no one thought the labor market was soft in January 2020.
Factors Affecting Job Growth
If the economy is below full employment and recovering, it will tend to add a high number of jobs each month. If it is at or near full employment and the population of working-age adults is growing rapidly, it will tend to add a high number of jobs each month. But neither of those conditions appear to hold at the moment. The prime-age employment-to-population ratio suggests the economy is at or near full employment. And, at the same time, broader demographic trends and more recent immigration enforcement efforts have contributed to slow growth in the population of working-age adults. Consequently, slow job growth should be expected.
Furthermore, if average job growth will tend to be slow when the economy is at or near full employment, then negative job growth will be more likely in any given month. The logic is straightforward. Above-average job growth in one month implies below-average job growth in some other month. The closer average job growth is to zero, the more likely below-average job growth means negative job growth.
Much the same can be said with respect to the high concentration of jobs in a single sector. If average job growth is zero, additional health care and social assistance jobs necessarily imply job losses in other sectors. With low (but positive) average job growth, some additional health care and social assistance jobs can be created without reducing jobs in other sectors. But there’s a limit. And, at least at present, it appears that our aging population requires some sectoral rebalancing of jobs.
Productive Job Losses
It is tempting to think that job gains are good and job losses are bad. But, of course, reality is much more complicated than that. Indeed, at least some of the job losses over the last year appear to be productivity-enhancing. In particular, the last year has seen a major reduction in government jobs, freeing up additional labor for the more-productive private sector.
From January 2024 to January 2025, the last year of the Biden administration, government employment increased 1.8 percent compared with just 0.6 percent growth in private employment. That excess government job growth has been largely undone by the Trump administration. In February 2026, government employment was just 0.8 percent higher than it had been in January 2024, whereas private employment was 0.9 percent higher.
Figure 3. Government and Private Employment, Jan 2024 – Feb 2026
The Labor Market Remains Near Full Employment
It is easy to understand why many market watchers are concerned by the latest employment data. They worry that slow job growth will become no job growth, and that no job growth will become negative job growth. But we must recognize the difference between what might happen and what has happened. At the moment, the economy appears to be at or near full employment, where slow job growth is the norm.