


Measuring state-level prices with adequate precision requires a lot of data collection, and there’s always a long lag between the time period measured and the release of the data. The BEA has now released its data on state-level prices and inflation for 2024, a year when US growth patterns diverged from their pandemic-era patterns.
California, believe it or not, was the fastest-growing state economy in 2024, once you adjust for inflation. Typically, California has featured about average nominal growth rates and higher-than-average inflation rates, resulting in lower-than-average real growth rates. But in 2024, that longstanding pattern reversed.
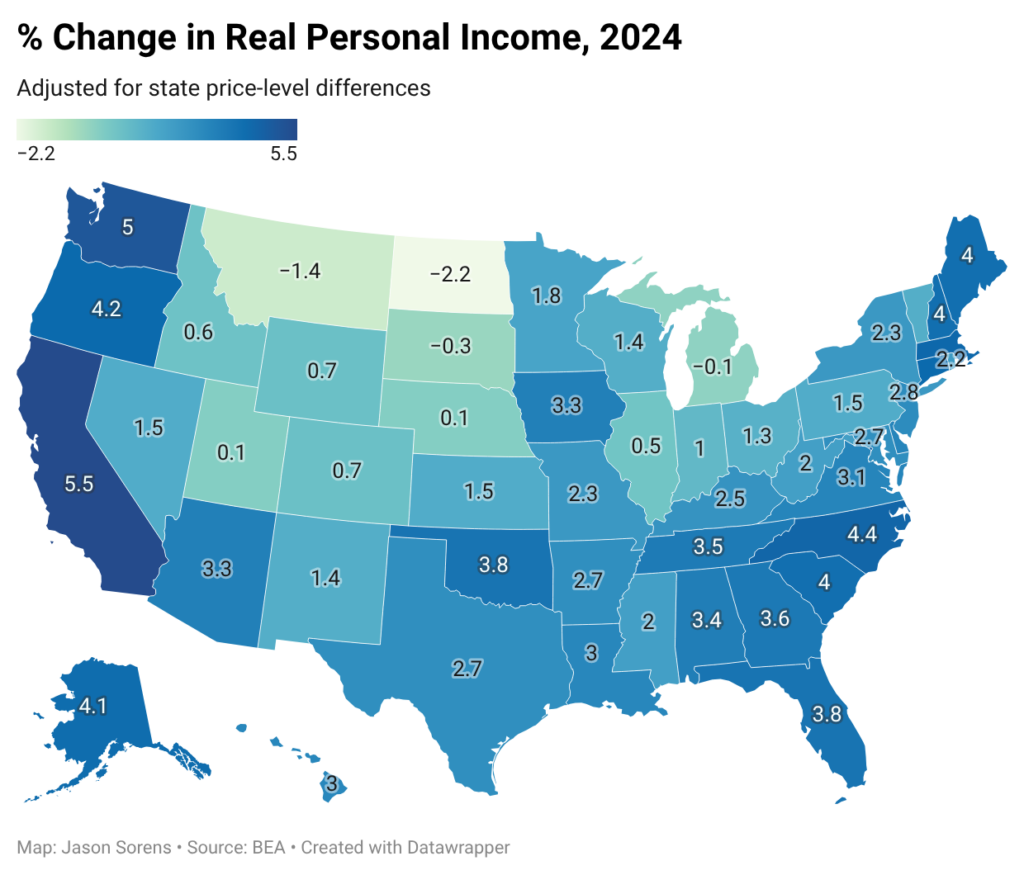
Indeed, the entire Pacific Coast did well in 2024, as did much of New England and the Carolinas. The Mountain West and the Midwest suffered by comparison (Figure 1).
Figure 1: Map of State Real Personal Income Growth Rates
How much of the growth in the Pacific Coast and New England states came from faster nominal income growth, and how much came from lower inflation? To answer this question, let’s look at nominal growth rates first (Figure 2). The Carolinas were the fastest-growing states by nominal income, followed by Idaho and California. The Dakotas and Nebraska stand out for slow nominal income growth. Most of New England is comfortably, but not dramatically, above average.
Figure 2: Map of State Nominal Income Growth Rates
The gap between nominal and real growth rates represents inflation. But let’s map inflation on its own (Figure 3). That Massachusetts had the lowest inflation rate in the US in 2024 may be a bit of a surprise. All the Pacific states are also low, as is New Hampshire. Montana had the highest inflation in the country, followed by Idaho, Utah, and Nevada. It’s worth noting here that low-population states tend to have the biggest year-to-year swings in inflation rates. It’s not that they tend to be higher or lower, just more volatile and less predictable.
Figure 3: Map of State Inflation Rates
It’s possible that growing housing demand in the Mountain West states may be responsible for their low real growth rates. If the people moving to the Mountain West states are productive workers, we would expect nominal growth rates to rise as well. Retirees, by contrast, don’t add as much to the productive capacity of an economy.
To look at the housing component specifically, I have mapped changes in state real price parities for rents in Figure 4. These numbers represent state-level change in rents relative to the US average. So a positive figure means that rents rose more rapidly in the state than in the US in 2024, and a negative figure means that rents rose more slowly in the state than in the US that year, not necessarily that they fell in absolute terms.
Figure 4: Map of State Change in US-Relative Rents
California had the third-lowest growth rate of rents in the US, after DC and Wyoming. That’s a dramatic turnaround for what is still America’s most expensive state for housing. The fact that the state maintained high nominal income growth alongside slow rental inflation implies that California’s slow rental inflation may be a result of new housing supply, rather than falling housing demand. If so, that means that the housing reforms that the state has enacted are starting to have an effect on production and rents. It’s plausible as well that the AI boom, in full swing already by 2024, had positive effects on California’s economy.
Montana had the fastest growth rate of rents in the US in 2024. Note that Montana’s famous housing reforms did not go into effect until at least September 2024, because they were under a district court injunction until then. The state’s high court upheld the reforms only in March 2025. There’s no way developers could have built that many homes between September and December 2024, even if they had filed building permit applications immediately after the injunction was lifted.
Why did the Great Plains states do so poorly? One possibility is commodity deflation. Export price indices for agricultural commodities (Figure 5) and mining, including oil and gas (Figure 6), declined after the pandemic, through 2023 and most of 2024.
Figure 5: Growth Rate of US Export Price Index for Agricultural Commodities
Figure 6: Growth Rate of US Export Price Index for Mining, Quarrying, and Oil and Gas Extraction
When the prices of commodities fall in global markets, the incomes of commodity producers tend to fall, unless they can significantly increase production. Low incomes in states reliant on commodities also impact the wages of, and demand for, local service industries. Global price fluctuations are far outside the control of state governments, but they are a fact of life for commodity producers and the firms that serve them.
It’s important not to overinterpret one year of state-level data, since these numbers can be so volatile. Over the long run, the evidence suggests that state policies that respect freedom of contract and private property rights promote real income growth. In the short run, random price fluctuations can have an outsized impact on averages. In 2024, it appears that commodity prices, the AI boom, and housing reforms (especially in California and possibly also Washington and Oregon) had a significant effect on state inflation-adjusted growth rates.