


The US Census Bureau just released state population data for mid-year 2025, along with updates for all previous years back to the 2020 Census. The Census estimates population growth with data on births, deaths, international migration, and “domestic migration” (among states and territories of the US). I always enjoy looking at the domestic migration data because they tell us a lot about where Americans prefer to live.
Freedom predicts net domestic migration fairly well. A lot of people have been pointing out the fact that Americans tend to move from “blue” to “red” states. The driving factor is not partisanship itself, but the different policies offered to residents of these states. The federal level has long been more complicated, but at the state level, Republican-led states still tend to enact “Reaganite” policies of limited government and free enterprise, while Democrat-led states tend to enact special-interest-oriented regulations and spending programs.
I’ve also seen a lot of people ranking states by total number of net domestic migrations (interstate moves in or out). Obviously, bigger states are going to dominate the top and bottom end of these rankings. Net domestic migrants over a period, as a percentage of the initial population, is much more useful. To make comparisons across periods of different lengths (as reported data often differ), divide by the number of years to yield an estimated average annual rate of net domestic migration.
Table 1 ranks the top and bottom ten states on average annual net migration rate for the April 2020 to July 2025 period, encompassing virtually all of the pandemic.
RankStateRateRankStateRate1Idaho1.52%41Rhode Island–0.18%2South Carolina1.48%42Maryland–0.44%3Montana1.10%43New Jersey–0.48%4Delaware1.08%44Massachusetts–0.52%5North Carolina0.91%45Louisiana–0.62%6Tennessee0.85%46Alaska–0.66%7Maine0.83%47Illinois–0.71%8Florida0.83%48Hawaii–0.82%9Arizona0.79%49California–0.86%10Nevada0.62%50New York–1.09%
Table 1: State Average Annual Net Domestic Migration Rates, 2020–2025
Some of these rates are quite large! New York, for example, is losing fully one percent of its population to other states every year, on average. At the other extreme, Idaho, South Carolina, Montana, and Delaware are growing by more than one percent of their population moving in from other states, on average per year.
The only Democratic-leaning states in the top 10 are Delaware and Maine, and the only Republican-leaning states in the bottom 10 are Louisiana and Alaska. When we look at these exceptions, unusual levels of freedom stand out. Louisiana is quite low on freedom for its region, #31 overall according to the Ruger-Sorens index of economic and personal freedom. The only Deep South state worse than Louisiana is its neighbor, Mississippi (#40). Mississippi, not coincidentally, was the only other Deep South state to experience net domestic out-migration over that five-year period (–0.15 percent per year).
While Delaware and Maine score low on freedom (#44 and #43, respectively), both were much higher on freedom relatively recently, and even now they score a lot better than New Jersey (#47), California (#48), Hawaii (#49), and New York (#50). Delaware was #15 on freedom as recently as 2001 and only fell consistently into the bottom 10 from 2017 on. Maine fell into the bottom 10 for the very first time in 2020 and is still #3 on personal freedom alone.
More sophisticated evidence from our study suggests that both economic and personal freedom independently drive in-migration.
Paul Krugman once criticized our findings on the grounds that housing costs supposedly explain migration better than freedom. (The left-leaning Center for Budget and Policy Priorities more recently made a similar claim.) But that’s wrong. Now, housing costs certainly do help explain state-to-state migration, and migration in turn affects housing costs, but our results stand up even when we control for overall state-level cost of living (the lion’s share of which reflects housing costs).
How else do you explain why Louisiana and Mississippi do so poorly? Their housing costs are low. And the parts of New York that have had the most out-migration are upstate New York, where housing costs are also low. New York City and Long Island have held up better. Illinois isn’t super-expensive either, and the affordable low-freedom states of New Mexico, Minnesota, and Nebraska are also losing people.
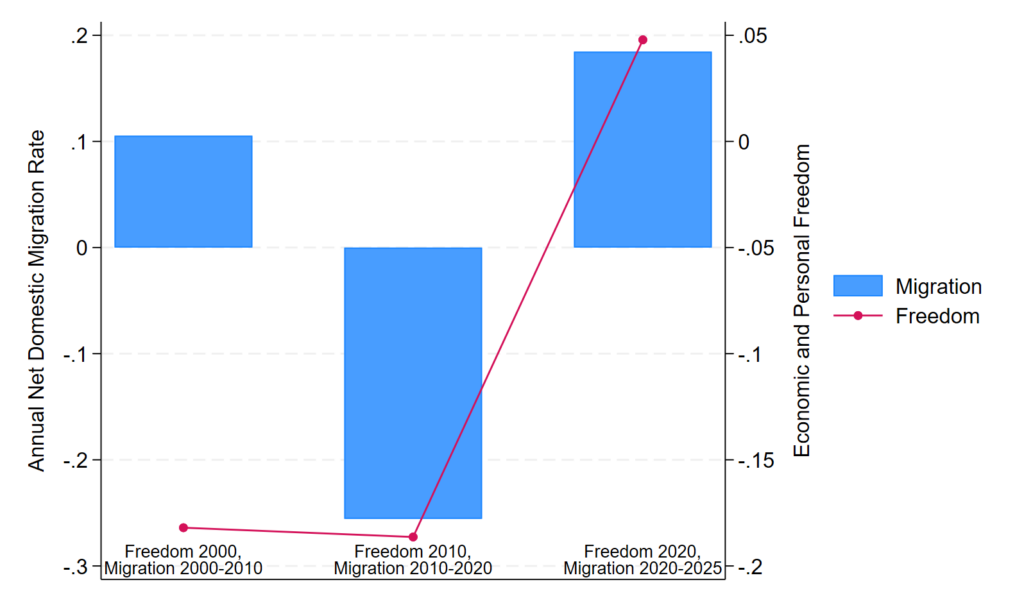
The strongest evidence might be from changes over time. West Virginia has had one of the biggest increases in freedom in recent years as a result of its partisan shift from heavily Democratic to heavily Republican. As its freedom has risen, it’s flipped from a net out-migration state to a net in-migration state (Figure 1).
Figure 1: Freedom and Net Migration in West Virginia Over Time
I also checked out Wisconsin, the #1 state for increase in freedom since 2010, largely as a result of Scott Walker’s governorship and the transformative changes Republicans made to the first state to adopt an income tax. Lo and behold, the same pattern emerges (Figure 2). Wisconsin’s big increase in freedom has been followed by a turnaround in its migration fortunes.
Figure 2: Freedom and Net Migration in Wisconsin Over Time
It’s a similar story with New Hampshire. New Hampshire’s always been high on freedom, unlike West Virginia and Wisconsin, but it’s also increased a great deal in recent years because of the efforts of the Free State Project. While the FSP has been around for a long time, people who moved to New Hampshire for the movement first took office in significant numbers in 2011 after the 2010 wave election. And their influence really built after about 2017, with the election of Chris Sununu as governor. Thus, New Hampshire’s increase in freedom has been plausibly a result of an exogenous political change, like the revolutions that have happened in West Virginia and Wisconsin. And we see a similar result (Figure 3). Again, New Hampshire always had a lot of freedom and was a state people wanted to move to, but those differences have strongly reasserted themselves in the 2020s.
Figure 3: Freedom and Net Migration in New Hampshire Over Time
What about states that have gone the other way and become less free as a result of exogenous political changes? Colorado and Virginia come to mind as states that have moved from the Republicans toward the Democrats, but Virginia did elect a Republican governor recently, and Colorado and Virginia merely had slightly lower than average increases in freedom between 2010 and 2020. Still, their migration rates fell off historic norms, with Virginia actually losing population on net to other states since 2020.
The two states that lost the most freedom between 2010 and 2020 were Hawaii and Oregon. We’ve already seen that these states have poor migration records. Figure 4 shows how freedom and migration have changed over time in Oregon.
Figure 4: Freedom and Net Migration in Oregon Over Time
The relationship isn’t perfect, because people moved to Oregon in greater numbers in the 2010s even after freedom had fallen. But by the 2020s, people had noticed – or so I would surmise. Freedom kept falling, and Oregon’s usual flood of in-migrants not only slowed to a trickle, but actually reversed to an outflow. It’s noteworthy that this happened even as the state of Oregon and the city of Portland made substantial reforms to increase the supply and reduce the cost of housing – reforms I support, but which are not enough to turn a state around economically from damaging taxes and regulation.
The latest Census data confirm what most of us knew all along: state policy regimes matter, and Americans prefer to live in states that offer more economic and personal freedom. Legislatures and governors, take notice!