


Note: The October-November readings for both the Consumer Price Index and the Everyday Price Index should be viewed as provisional rather than definitive. A temporary government funding lapse interrupted standard federal price collection, leaving gaps that could not later be filled and forcing reliance on limited alternative inputs. Data collection resumed partway through November, restoring more normal coverage only as the month progressed.
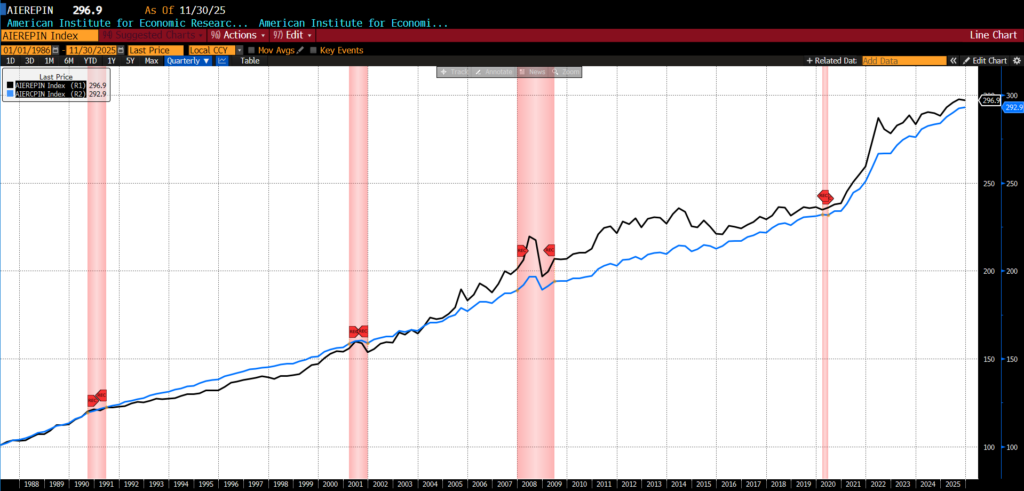
The AIER Everyday Price Index (EPI) fell 0.24 percent to 296.9 throughout October and November 2025, ending ten months of consecutive increases. Of its 24 constituents, the prices of 13 rose, three were unchanged, and eight declined. Those showing the largest increases included postage and delivery services, admissions to movies, theaters, and concerts, and tobacco and smoking products. Declining in price the most were motor fuel, food at home, and personal care products.
AIER Everyday Price Index vs. US Consumer Price Index (NSA, 1987 = 100)
(Source: Bloomberg Finance, LP)
Also on December 18, 2025, the US Bureau of Labor Statistics (BLS) released its combined November and December 2025 Consumer Price Index (CPI) data. Consumer prices continued to cool on a year-over-year basis through November, with headline inflation decelerating to 2.7 percent, down from a 3.0 percent pace earlier in the fall. Core inflation, which excludes food and energy, rose 2.6 percent over the past year, broadly matching the increase in food prices and underscoring a general moderation in underlying price pressures.
October-November 2025 US CPI headline and core year-over-year (2015 – present)
(Source: Bloomberg Finance, LP)
Energy costs remained a notable exception, advancing 4.2 percent year-over-year, led by sharp gains in fuel oil, electricity, and natural gas, while gasoline prices posted only modest increases. Food prices rose 2.6 percent overall, with meals consumed away from home climbing more quickly than groceries, as full-service dining costs rose 4.3 percent and limited-service establishments saw prices increase 3.0 percent. Shelter inflation eased but remained elevated at 3.0 percent, continuing to contribute meaningfully to core measures. Other categories registering notable annual increases included household furnishings and operations, medical care, used vehicles, and recreation, though most advanced at a slower pace than in prior periods.
Underlying US inflation eased meaningfully between September and November. On a combined October to November basis, average monthly inflation was notably subdued: headline CPI advanced just 0.10 percent per month, while core CPI rose 0.08 percent, implying annualized core inflation rates of 1.6 percent over three months and 2.6 percent over six months, well below late-summer readings. Goods inflation continued to cool, with non-energy goods rising 1.4 percent year-over-year and many tariff-exposed categories outright deflating amid aggressive holiday discounting. Services inflation also softened, as shelter prices rose just 3.0 percent year-over-year: the slowest increase in more than four years. Key Fed-watched services measures excluding housing and energy advanced only 2.7 percent, matching their lowest pace since 2021.
Interpretation of the report is complicated by the federal government shutdown, which disrupted October data collection and forced the BLS to rely heavily on imputation. Additionally, a narrow set of non-survey price series representing roughly 11 percent of the CPI basket were employed. For most categories, October prices were carried forward from September, including owners’ equivalent rent and primary rents; an approach that likely biased measured inflation lower across October and November. Collection delays in November may also have captured more holiday discounting than usual, particularly around Black Friday, despite extended BLS collection efforts. As a result, month-to-month comparisons are less reliable, and some of the apparent disinflation, especially in housing, should be treated with caution. Nevertheless, third-party and online price data broadly corroborate declines in discretionary goods and tariff-exposed categories, suggesting the slowing seen in the data is not a purely statistical aberration.
Beneath the noise, several trends appear durable: grocery prices declined on average over the two months, with eggs plunging 11 percent cumulatively. Apparel, computers, toys, and sporting goods all posted outright deflation; and lodging away from home fell sharply, pointing to softening demand in discretionary services. Energy prices were mixed, rising modestly overall, while auto prices remained a partial holdout as used vehicles still show increasing prices on a monthly basis. Auto parts and equipment fell.
Financial markets have clearly interpreted the report as broadly dovish, with equities rising, Treasury yields falling, and the dollar weaker despite Fed officials remaining divided on the policy path amid lingering data uncertainty. Altogether, the October–November CPI release suggests inflation momentum is waning, tariff pass-throughs may be fading, and underlying price pressures are cooling, all of which increase the odds of earlier and deeper rate cuts in 2026 even if policymakers remain cautious about acting on distorted near-term data.