


The week of July 28 to August 1, 2025, was packed with major economic data releases. In addition to the Federal Open Market Committee (FOMC) decision on interest rates, markets digested the advance estimate of second-quarter US GDP, the Job Openings and Labor Turnover Survey (JOLTS), ADP employment figures, personal consumption expenditure (PCE) inflation data, retail sales, and more.
But it was the Friday, August 1 release of the July 2025 nonfarm payrolls (NFP) report — along with revisions to the May and June figures — that most caught the attention of markets and economic observers. The headline NFP print for July came in at just 73,000 jobs added — below consensus expectations of a 105,000 job gain. But it was the revisions that shocked: May’s number was revised down by 125,000 jobs, and June’s by 133,000; a staggering, cumulative downward adjustment of 258,000 jobs.
Within hours, Erika McEntarfer, the Commissioner of the Bureau of Labor Statistics was dismissed by President Trump, a move that drew both applause from administration allies and alarm from economists concerned about the politicization of statistical agencies. Yesterday, President Trump reiterated his view that the “Job’s [sic] Report was RIGGED … Those big adjustments were made to cover up, and level out, the FAKE political numbers that were CONCOCTED[.]” But were the downward revisions truly unusual? How rare is a revision of this magnitude in historical context?
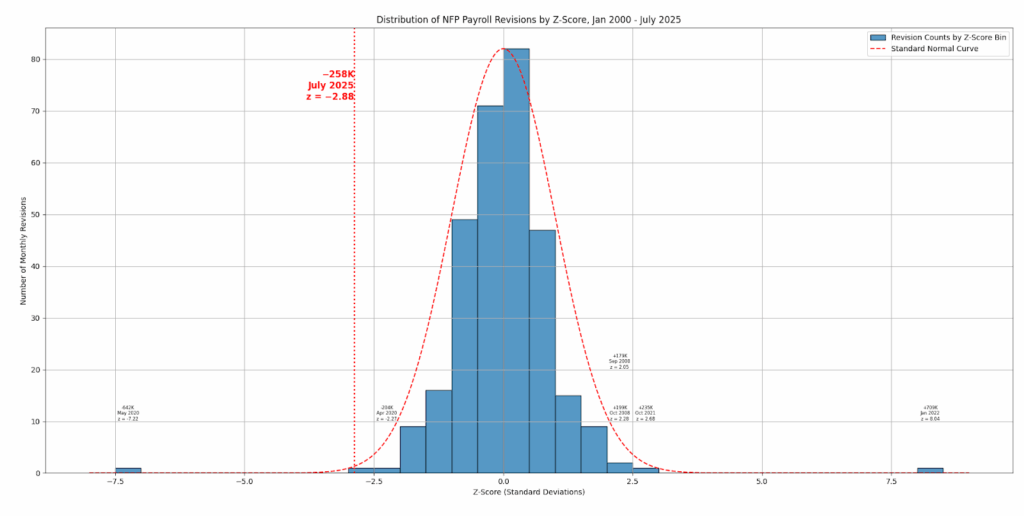
The July 2025 payroll revision figure of –258,000 drew attention not just for its magnitude, but for its apparent statistical improbability. With a z-score of –2.88 — meaning it lies nearly three standard deviations below the mean of historical revisions — the number stands out starkly against standard statistical benchmarks. Under the assumptions of a normal (Gaussian) distribution, a deviation of that size or greater would be expected to occur less than 0.2 percent of the time, or roughly once in every 500 observations. Given that the current dataset spans 306 months, the implication is clear: this is a rare event.
Yet that conclusion rests on a flawed premise — the assumption that the underlying distribution of payroll revisions is normal, or essentially so. In reality, the data tell a different story. The full distribution of monthly revisions exhibits moderate right skew (0.46) and extraordinarily high kurtosis (21.56), pointing to a distribution that is slightly asymmetrical but extraordinarily prone to producing outliers. High kurtosis is a signature of a “fat-tailed” distribution: one where extreme values occur more frequently than a normal model would predict.
Indeed, a glance at the historical data confirms this. Several past revisions fall well outside the ±3σ range, with the most extreme values exceeding seven standard deviations from the mean. In a Gaussian framework, such a reading would imply a probability on the order of one in 100 trillion — a vanishingly small likelihood, inconsistent with the actual occurrence of such events. This disconnect is not a statistical curiosity but a diagnostic of model misspecification. Relying on the normal distribution to describe a process that clearly deviates from it introduces a host of analytical errors and woefully erroneous conclusions.
In this light, the July revision is not best understood as an inexplicable outlier or an error to be second-guessed, but as a member of a class of legitimate observations that reflect the underlying volatility of labor market data and the revision process itself. Measurement lags, survey adjustments, and methodological updates — especially during periods of economic transition or uncertainty — contribute to a dynamic in which large revisions are not just possible, but inevitable.
This matters for both interpretation and policy. Analysts, economists, and financial market participants who build models assuming normality risk systematically underestimating the likelihood of large revisions. Forecast error bands may be too narrow, confidence intervals overly optimistic, and risk assessments poorly calibrated. Policymakers might overreact to perceived anomalies or misread noise as signal.
The heavy-tailed nature of BLS payroll revision data — meaning it produces unusually large outliers more frequently than a normal distribution would predict — can be traced to structural and economic factors. First, many of the most extreme revisions cluster around periods of major economic stress or transition, such as the 2008–2009 financial crisis and the COVID-19 pandemic, when labor market conditions shifted rapidly and initial estimates were based on incomplete or outdated assumptions. Second, the BLS relies on survey data with limited initial response rates; as more responses arrive or updated seasonal adjustment models are applied, large corrections can result. In fact, response rates to the BLS establishment (business) and household survey have declined from over 60 percent to just over 40 percent in the last half decade.
US Bureau of Labor Statistics nonfarm payrolls revisions (black) and current employment statistics survey response rate (red), 2014–present
(Source: Bloomberg Finance, LP)
Third, abrupt policy changes, natural disasters, or statistical anomalies (like misclassification of temporary workers or business births/deaths) can distort early readings.
Revisions are not just corrections — they are a window into the challenge of measuring a dynamic, multi-trillion-dollar labor market in real time. One potential remedy would be to reduce the frequency of nonfarm payroll releases to a quarterly or triannual schedule, trading timeliness for accuracy; however, the resulting gain in statistical precision would come at the cost of fewer real-time insights into labor market dynamics.
More broadly, the presence of fat tails in payroll revision data is a reminder that the real economy, as captured in high-frequency indicators, often resists tidy statistical assumptions. Understanding and embracing the empirical distribution — rather than forcing it into a normal mold — yields more robust inferences and better prepares analysts for the genuinely unexpected.
In short, while the 258,000 revision in July 2025 is undeniably large, it is not an aberration in the true statistical sense. It is an emphatic example of a structural feature of the data — and a call for caution in applying oversimplified models to complex empirical realities. Ironically, casting statistically unusual or politically inconvenient data as conspiratorial will only serve to undermine trust in future releases, rendering them more — not less — politically charged.